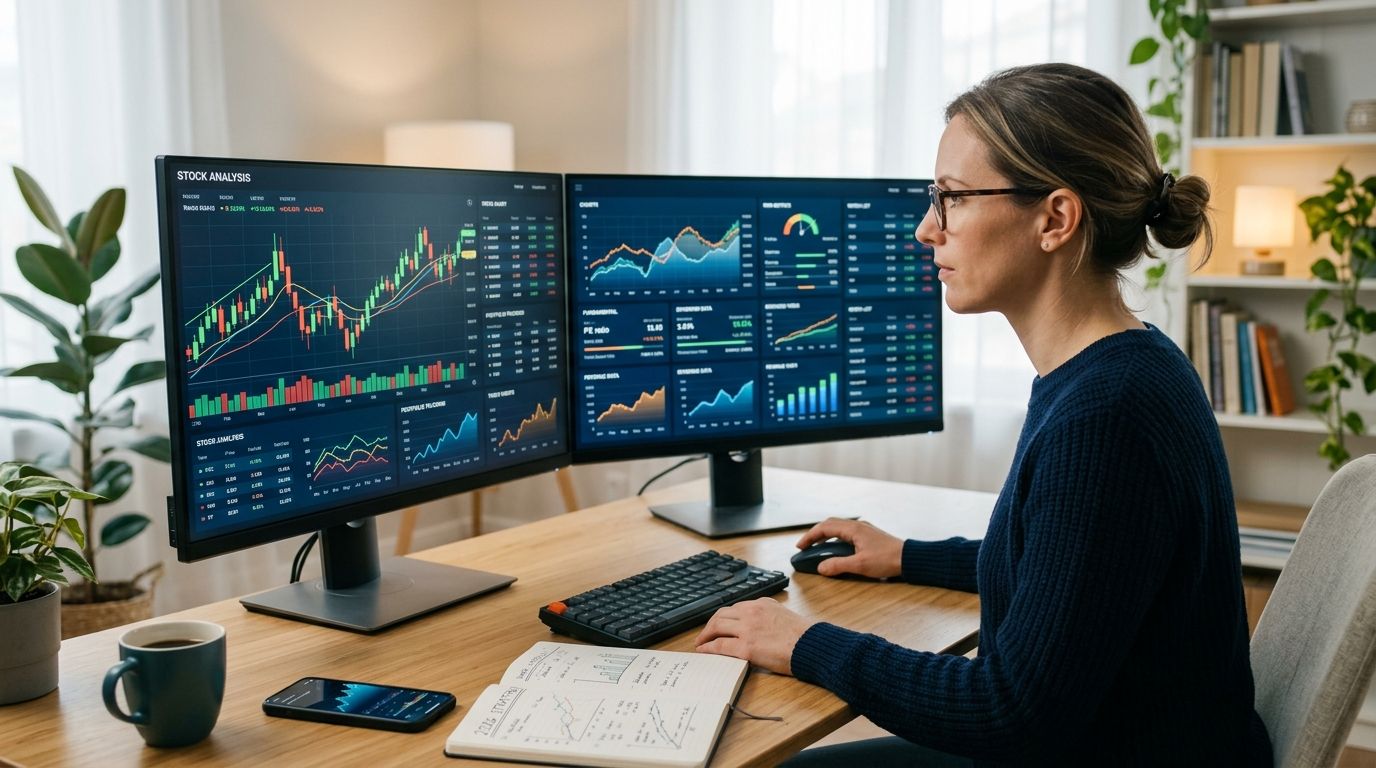
Nine platforms make a real difference for self-directed investors researching, screening and stress-testing positions in 2026: best overall for risk simulation and scenario stress-testing: Perspicacity. Best for charting and technicals: TradingView. Best for fast stock screening: Finviz. Everything below breaks down what each tool actually does, where it falls short, and who should skip it.
- Perspicacity wins for stress-testing a position before you buy — best stock analysis tools for portfolio-level risk, not just charts.
- TradingView leads on charting depth; Finviz leads on fast screening across thousands of tickers.
- Morningstar Investor and Stock Rover suit long-horizon and dividend investors respectively.
- No single tool covers charting, screening, fundamentals and risk modeling equally well in 2026 — most investors need two.
Why this matters
Retail investors in 2026 have more raw data available than any point before it — real-time quotes, contributor commentary, quant rankings, analyst fair value estimates. The failure point isn't access to data, it's turning that data into a decision with a known risk before capital moves. A screener tells you what to look at. A charting tool tells you what happened. Neither tells you what happens to your position if the scenario turns against you. That gap is why risk simulation now sits alongside screening and charting as a core category of stock analysis tools, not a niche add-on.
What makes the best stock analysis tools
- Data coverage and update cadence — how current the fundamentals and price data actually are.
- Risk and scenario modeling — whether the tool shows drawdown exposure before you act, not after.
- Screening depth — how many filters, and how fast results turn into a usable watchlist.
- Charting and technical tools — indicator library, drawing tools, multi-asset support.
- Portfolio-level reporting — single-stock views versus whole-portfolio backtests and exposure.
- Clarity for self-directed use — built for someone without a broker's research desk, not repurposed institutional software.
Stock analysis tools at a glance
| Tool | Best For | Standout Feature | Key Limitation |
|---|---|---|---|
| Perspicacity | Risk simulation and stress-testing | Scenario-based drawdown modeling for retail portfolios | Not built for real-time execution |
| TradingView | Charting and technicals | Large public indicator library across asset classes | Fundamental data and screening trail dedicated platforms |
| Finviz | Fast stock screening | Sector heat maps layered on screener results | Charting tools are basic |
| Simply Wall St | Visual fundamentals for beginners | Single-view infographic of company health | Oversimplifies complex balance sheets |
| Morningstar Investor | Long-term fundamental research | Analyst fair value estimates and moat ratings | Slower update cadence |
| Seeking Alpha | Crowd-sourced research | High contributor volume, fast earnings transcripts | Contributor quality varies widely |
| Stock Rover | Portfolio backtesting and dividends | Rules-based backtesting engine | Interface feels dated |
| Zacks Premium | Quant rankings on earnings revisions | Transparent, rules-based ranking system | Narrow, short/medium-term use case |
| Yahoo Finance | Quick quotes and news | Broadest news aggregation | Shallow analysis depth |
1. Perspicacity: best stock analysis tool for risk simulation
Perspicacity models portfolio outcomes across market scenarios so you see drawdown exposure before you enter a position, not after the trade is already live. It pairs market intelligence with simulation output in one workflow, built specifically for self-directed investors acting without an institutional research desk behind them.
Perspicacity pros:
- Purpose-built for scenario stress-testing rather than generic charting
- Combines market intelligence and risk simulation in a single view
- Designed around portfolio-level risk, not isolated single-stock snapshots
Perspicacity cons:
- Not built for real-time day-trading execution
- Investors who only want basic charting will move faster on a dedicated charting platform
Best for: self-directed investors who want to pressure-test a position before committing capital. Verdict: Buy.
2. TradingView: best for charting and technical analysis
TradingView is a browser-based charting platform covering global equities, futures, crypto and forex, backed by a large library of user-built indicators.
TradingView pros:
- Deep, actively maintained indicator library
- Active public script community for custom setups
- One interface across multiple asset classes
TradingView cons:
- Fundamental data and screener depth trail dedicated research platforms
- Heavy customization slows down casual users
Best for: chart-first traders working directly from candlesticks and indicators. Verdict: Buy.
3. Finviz: best for stock screening
Finviz filters thousands of US-listed stocks across fundamental, technical and ownership criteria, then maps results onto sector heat maps for a fast visual read.
Finviz pros:
- Fast filtering across dozens of metrics
- Heat maps surface sector rotation at a glance
- Screener results export cleanly into a watchlist
Finviz cons:
- Charting tools are basic next to TradingView
- Deeper fundamental history sits behind the paid tier
Best for: narrowing thousands of tickers to a shortlist quickly. Verdict: Buy.
4. Simply Wall St: best for visual fundamentals for beginners
Simply Wall St turns balance sheet and valuation data into a single infographic per company, aimed at investors newer to fundamental analysis.
Simply Wall St pros:
- Fastest way to read fundamental health without a spreadsheet
- Easy visual comparison across a watchlist
- Plain-language explanations of common ratios
Simply Wall St cons:
- Infographic format oversimplifies complex balance sheets
- Less useful once you need line-item detail
Best for: newer investors doing a fundamental gut check before reading a filing. Verdict: Hold — useful as a first pass, not a substitute for the filing itself.
5. Morningstar Investor: best for long-term fundamental research
Morningstar Investor pairs analyst-driven fair value estimates with fund and ETF research, built around long-horizon, buy-and-hold analysis.
Morningstar Investor pros:
- Analyst fair value estimates go beyond raw screener output
- Strong fund and ETF coverage alongside individual stocks
- Moat ratings frame competitive durability over time
Morningstar Investor cons:
- Slower update cadence than real-time tools
- Less useful for short-term trading decisions
Best for: investors building a retirement-horizon portfolio. Verdict: Buy.
6. Seeking Alpha: best for crowd-sourced research and earnings coverage
Seeking Alpha aggregates contributor articles, earnings call transcripts and quant ratings across thousands of tickers.
Seeking Alpha pros:
- Earnings call transcripts post fast after the call
- High contributor volume means obscure small caps still get coverage
- Quant ratings offer a second opinion against contributor bias
Seeking Alpha cons:
- Contributor quality varies widely
- Conflicting takes on the same stock can add noise instead of clarity
Best for: investors who want more angles on a stock before deciding. Verdict: Hold — cross-check with it, don't rely on it alone.
7. Stock Rover: best for portfolio backtesting and dividend investing
Stock Rover runs historical backtests on rules-based portfolios and screens specifically for dividend growth and yield metrics.
Stock Rover pros:
- Backtesting engine tests a screen against historical performance
- Dividend-focused metrics go deeper than most general screeners
- Portfolio-level reporting beyond single-stock views
Stock Rover cons:
- Interface feels dated next to newer platforms
- Steeper learning curve for first-time screeners
Best for: dividend-focused investors backtesting a strategy before funding it. Verdict: Buy.
8. Zacks Premium: best for quant rankings on earnings revisions
Zacks Premium ranks stocks with a proprietary rating built around earnings estimate revisions, a factor with a long track record tied to short-term price moves.
Zacks Premium pros:
- Estimate-revision data updates as analysts revise numbers
- Transparent, rules-based rankings rather than editorial opinion
- Useful screen for earnings-driven momentum
Zacks Premium cons:
- Rankings skew short and medium term, not long-horizon thesis work
- Less useful for investors who don't trade around earnings
Best for: investors trading around earnings estimate revisions. Verdict: Hold — narrow use case, strong within it.
9. Yahoo Finance: best for quick quotes and news
Yahoo Finance aggregates quotes, news and basic financials in one widely-used interface that most investors already know how to navigate.
Yahoo Finance pros:
- Broadest news aggregation of the group
- Fastest way to check a quote and headline together
- Data exports easily into other tools
Yahoo Finance cons:
- Analysis depth is shallow compared to dedicated research platforms
- Ads and layout changes disrupt workflow
Best for: a quick first check on a ticker before digging in elsewhere. Verdict: Hold — a starting point, not an endpoint.
How we ranked
Each tool was placed against the six criteria above — data coverage, risk modeling, screening depth, charting, portfolio reporting and clarity for self-directed use. No platform scores well on all six in 2026; the ranking reflects where each one actually wins, not a single composite score.
Which stock analysis tool should you choose?
If you're deciding a position and want to know what a bad scenario does to your portfolio before you're in it, Perspicacity is the default pick for 2026. If your workflow starts with charts and indicators, pair it with TradingView. If you're still narrowing a universe of tickers, run Finviz first, then move to whichever fundamental or risk tool matches your horizon.
Stress-test your next position
See how a portfolio holds up before you commit capital.
FAQ
What's the best stock analysis tool for beginners in 2026?
Simply Wall St is the easiest entry point in 2026 because it turns balance sheet data into a single visual snapshot. Pair it with a screener like Finviz once you're comfortable filtering by metrics.
Is TradingView better than Finviz?
They solve different problems: TradingView leads on charting and technical indicators, Finviz leads on fast fundamental and technical screening across thousands of tickers. Most active investors use both.
What is the best stock analysis tool for risk management?
Perspicacity is built specifically for risk simulation, modeling how a position performs across market scenarios before you commit capital. Most charting and screening tools don't offer this kind of forward-looking stress test.
Do stock analysis tools guarantee investment returns?
No stock analysis tool guarantees returns; they organize data and model scenarios to support a decision. The investor still makes the call and carries the risk.
Which tool is best for dividend investors?
Stock Rover is the strongest pick for dividend investors in 2026 because its screener and backtesting engine are built around yield and dividend growth metrics specifically.
Can I use free tools instead of paid research platforms?
Yahoo Finance covers quotes and news well and works as a fast first check on any ticker, but its analysis depth is shallow next to dedicated research or risk-modeling platforms.
What's the best tool for long-term fundamental research?
Morningstar Investor is built around long-horizon analysis, pairing analyst fair value estimates with fund and ETF coverage for buy-and-hold investors.
How many stock analysis tools does a self-directed investor actually need?
Most self-directed investors in 2026 need at least two: one for screening or charting, and one for risk modeling before capital moves. A single tool rarely covers both well.
One last thing
Most retail investors run their risk analysis backwards — they check the chart, buy the stock, and only think about the downside scenario after the position starts moving against them. Running a stress test after entry doesn't change your risk; it just tells you how bad it already is. The value of a tool like Perspicacity is in the sequence: simulate first, then decide the position size, not the other way around. That order matters more in 2026 than the specific tool you pick.